You can use the campaign analytics tool to measure the effectiveness of the marketing campaigns you've created in HubSpot. The tool analyzes five metrics to quantify how your marketing content contributes directly to closed deals and revenue. Learn more about the data pulled to provide you these metrics and how you can analyze your campaign in the campaigns tool.
- In your HubSpot account, navigate to Reports > Analytics Tools.
- Click Campaign Analytics.
- Use the Date range and Frequency dropdown menus to filter the data to a specific time range.
- This will filter the data in any tab you're in.
- A week in the report starts on Sunday by default, when the date range selected consists of a week, or when the frequency is set to Weekly.
Chart
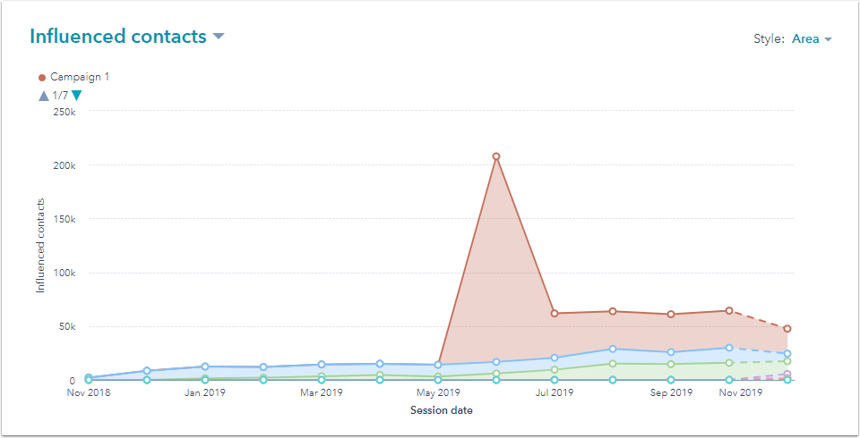
- In the upper left of the chart, click the dropdown menu and select the report metric.
- In the upper right of the chart, click the Style dropdown menu and select the type of chart you want to use for analysis. You can select an area chart, a column chart, or a line chart to view your data.
Table
Below your chart, there's a table with metrics for your analytics.
- To customize the metrics that appear in the table:
- In the upper right, click Edit columns.
- In the dialog box, select the checkbox for each metric you want to display.
- Click the X next to a property in the Selected columns section to remove it from the table.
- Click Save to apply these changes.
- Enter search terms in the search bar to search for a specific campaign.
- Click a column header to sort the campaign by that metric.
- In the table below, select the checkbox next to a campaign to include it in the chart. Select multiple pages to compare their impact.
- Click a campaign to view its details in a new tab.
Please note: HubSpot only attributes data from assets or content to a campaign after the asset or content is associated with the campaign. Any metrics (e.g., new contacts) prior to the association will not be included in the campaign analytics.
Export or save as report
You can also save the chart as a report in your reports list:- On the right, click Save as report.
- In the dialog box, enter the Report name.
- To add the report to a dashboard, click the Add to dashboard dropdown menu and select if you want to add it to an existing dashboard or create a new custom dashboard.
- If you select Existing dashboard, click the Select existing dashboard dropdown menu and select the dashboard to add the report to.
- If you select New custom dashboard, enter the Custom dashboard name and click the Visibility dropdown menu to select if the dashboard should be shared, shared but read only to others, or private to your own user.
- Click Save & add.
Metrics
Influenced contacts
Measures the number of contacts (new and existing) that have engaged with assets related to a campaign. A contact is influenced by a campaign when:
- they visit a URL with a corresponding utm_campaign parameter.
- they visit content associated with the campaign.
- their first page view has a referral keyword associated with the campaign.
- they click or view a CTA associated with the campaign.
- they interact with an associated social message.
- they enroll in an associated workflow.
- they open or click an associated email.
Please note: when filtering influenced contacts by Date range, only net new contacts that were influenced in that date range will be included. For example, if you filter for This week, you will not see contacts that were influenced prior to this week, even if they were also influenced this week.
Sessions
Measures traffic to website assets related to the campaign. Sessions will be attributed to a campaign when:- a visitor visits a page or blog post URL contains utm_campaign parameters.
- a visitor views a page or blog post associated with the campaign.
- a visitor arrives at a page or blog post through an associated referral keyword.
New contacts (first touch)
The number of newly created contacts, attributed to the campaign that brought them to your website for the first time. Contacts will appear in this report when:
- the first page they visit has a URL containing utm_campaign parameters.
- the first page they visit is associated with the campaign.
- the first page they visit is through a referral keyword associated with the campaign.
New contacts (last touch)
The number of newly created contacts, attributed to the campaign that led to their conversion. Contacts will appear in this report when:
- they convert on a page where the URL contains utm_campaign parameters.
- visit a page or submit a form that's associated with the campaign before converting, during the same session.
Influenced deals
The number of closed won deals associated with influenced contacts. In order for a deal to appear in this report:
- the deal must be closed after the contact is influenced by the campaign.
- the deal must be associated with the contact at the time that it is closed.
Please note: if a deal doesn’t have a value in the Close date property, HubSpot will use the date that the Deal stage was set to Closed Won instead. If you filter this report by date range but aren’t seeing the deals that you expect, make sure that the Close date property is set correctly.
Influenced revenue
The total revenue of closed won deals that are associated with influenced contacts. The total is from the sum of the Amount property of closed won deals. Only influenced deals will contribute to this total.