Your sales dashboard includes five reports by default, each designed to give you an overview of your sales process. Learn how to customize the reports on your dashboard and your dashboard settings.
Deal Forecast
The deal forecast report shows the amount of forecasted revenue for deals in your deal pipeline. This is calculated by multiplying the deal amount of each deal by the deal stage probability. For example, there are three deals, each worth $1000. The probability of close for each deal is 100%, 90%, and 40%, respectively. The forecasted revenue is therefore calculated as follows: (1000 * 1) + (1000 * .9) + (1000 *.4) = 2300.
This report will show all deal stages. Deals will appear here only if they have an amount and a close date that falls within the dashboard date range.

Deals Closed vs Goal
This report shows revenue from closed deals compared to your team’s quota or a custom goal. Use this report to track your team’s progress over time and to help set better sales goals. This report includes deals that were closed as won within the selected date range.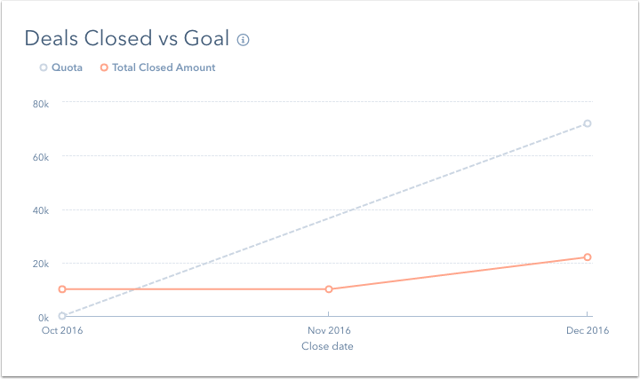
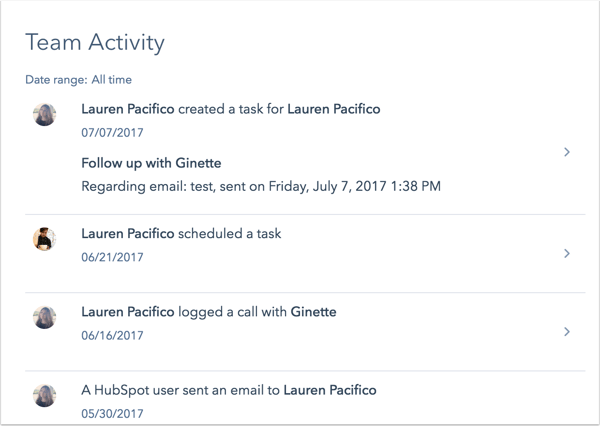
Team Activity
This report shows the 20 most recent sales activity for your sales users within the selected date range. Click an activity to be taken to the associated record.
Sales Performance
The sales performance widget includes five metrics:
- Contacts Created: the total number of new contacts created during the selected date range that are assigned to the user selected in the Team members dropdown.
- Contacts Assigned: the total number of contacts assigned to the user selected in the Team members dropdown menu during the selected date range. If the Team members filter is set to All team members, this will show the count of contacts with any HubSpot owner assigned. Contacts that do not have a value set for Contact owner will not be counted here.
- Contacts Worked: this is the total number of contacts who were contacted via a sales engagement (call, email, or meeting) during the selected date range by the selected team member. Engagements must be logged in the CRM to be counted here.
- New Deals Created: the total number of deals created during the selected date range that are assigned to the selected team member.
- Deals Closed Won: this is the total number of deals marked as closed won with a close date within the selected date range and assigned to the selected team member.

Productivity
This report shows the total number of calls; emails sent from the CRM; emails logged in the CRM using the BCC to CRM address; emails logged as activities on a contact's record; notes; tasks; and meetings that occurred during the selected date range by the selected team member. Hover over the data and click Quick view to see a list of the engagements in each category.
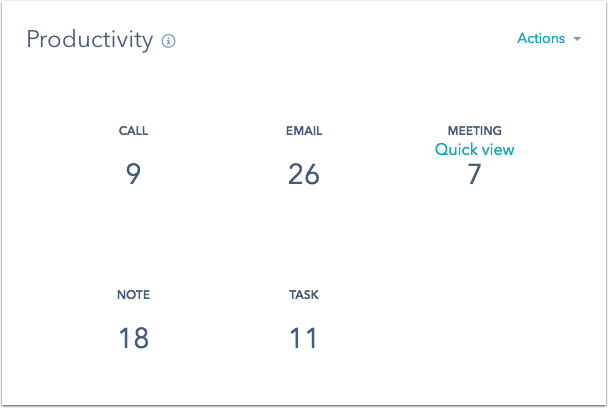
Please note: tasks will appear on the productivity report when the due date for the task is within the selected time range.