Use the service dashboard in HubSpot to view your ticket, knowledge base, and customer feedback performance at a glance. You can also add pre-built service reports or create custom reports (Service Hub Professional and Enterprise users only) to add to the dashboard. Below are overviews of each report that appears by default on the service dashboard depending on your subscription level.
To view your service dashboard:
- Navigate to your HubSpot dashboards by clicking the sprocket icon sprocket in the top left corner of your account.
- In the upper left, click the dashboard name, then select Service Dashboard.
Tickets by Source
This report shows your total number of support tickets by where they originated. Use this report to track the source of your tickets over time and decide how to staff and support your ticket channels.

Tickets Closed by Owner
This report shows your total number of support tickets that have been closed by their owner. Use this report to get a high-level understanding of team productivity.

Ticket Volume Over Time
This report displays a graph of your ticket volume over time. Use this report to get a sense of ticket volume over time, and how key changes to your product or service drive support volume.

The frequency of the graph is Weekly by default. Hover over the report and click Edit report settings to change the frequency of the graph.
Knowledge Article Views Over Time (Service Hub Professional and Enterprise only)
This report displays a graph of your knowledge article views over time. Use this report to understand how your support documentation is helping your customers and scaling up your support team.

The frequency of the graph is Daily by default. Hover over the report and click Edit report settings to change the frequency of the graph.
Learn more about analyzing your knowledge base performance.
NPS Over Time (Service Hub Professional and Enterprise only)
This report displays a graph of your company's NPS over time. Use this report to get a high level view of how your company’s average NPS changes over time.

The frequency of the graph is Daily by default. Hover over the report and click Edit report settings to change the frequency of the graph.
Learn more about analyzing your customer feedback.
Feedback Stream (Service Hub Professional and Enterprise only)
This report shows the latest customer feedback you've received. Use this report to keep a constant pulse on exactly what your customers are saying about you.

The report shows feedback from NPS by default. Hover over the report and click Edit report settings to change the feedback to CES.
Add pre-built or custom reports to the service dashboard (Service Hub Professional and Enterprise only)
- Navigate to your HubSpot dashboards by clicking the sprocket icon sprocket in the top left corner of your account.
- In the upper left, click the dashboard name, then select Service Dashboard.
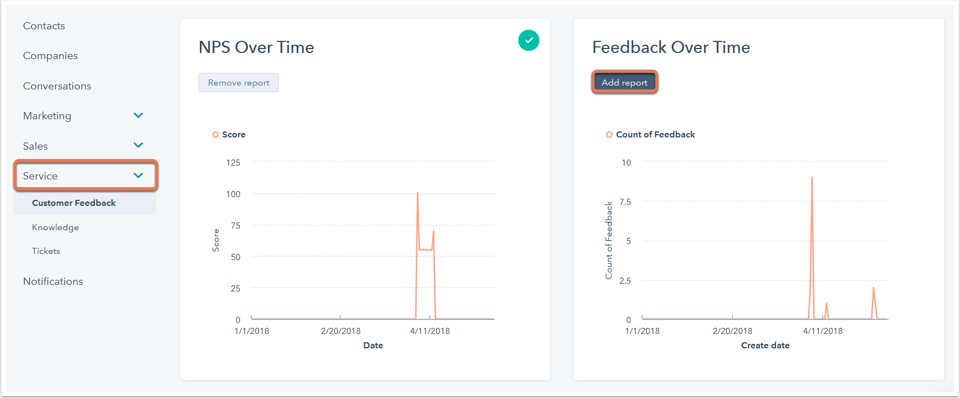
- In the upper right, click Add report.
- To add a pre-built service report:
- In the left sidebar menu, navigate to Service > Customer Feedback, Knowledge, or Tickets.
- Click Add report on a specific report to add it to the dashboard.
- To create and add a custom report:
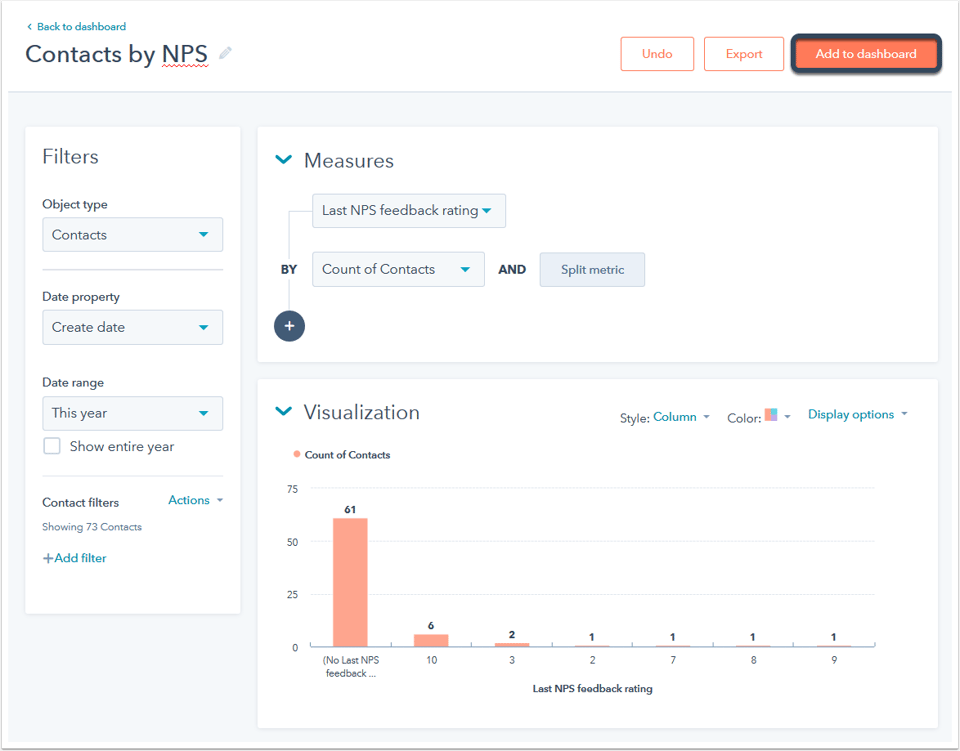
- In the upper right, click Create custom report.
- Create and customize your custom report.
- In the upper right, click Add to dashboard.